
Project: Smart Thermostat
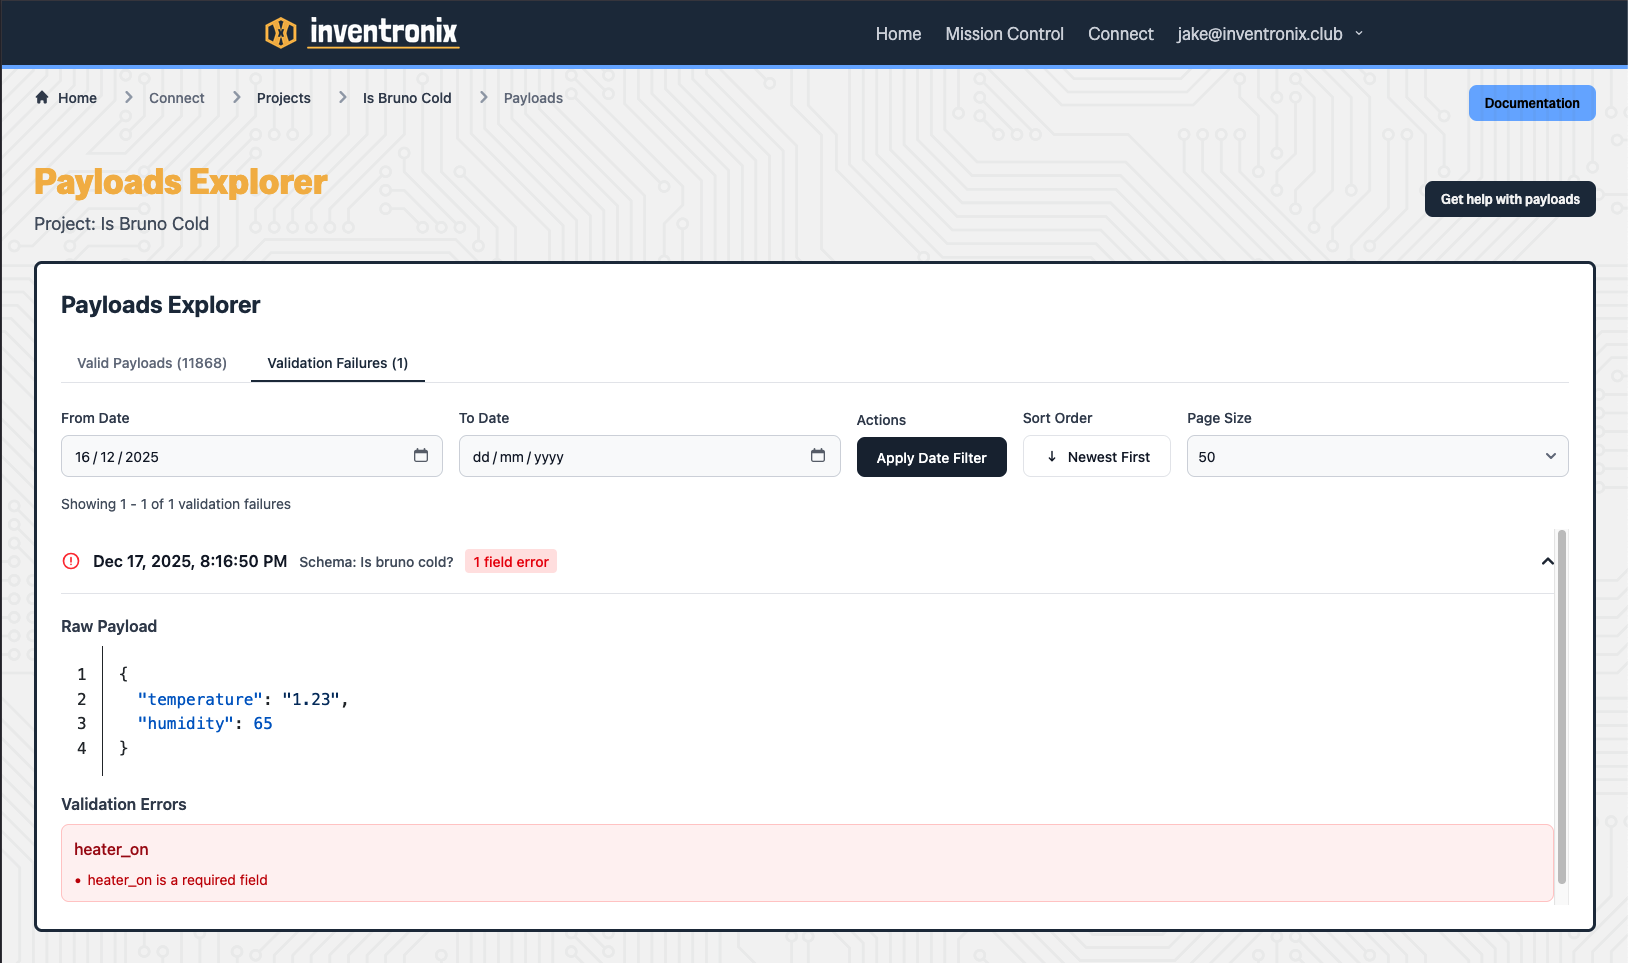
You can see all your validation failures and the reasons they failed in the Validation Failures section of Payloads Explorer
Inventronix Connect makes this super easy. No need for servers or any backend, just set up your project and go!
This guide walks through building a smart thermostat that monitors temperature and automatically controls a heater. By the end, you'll have a complete IoT system that maintains a target temperature range, with real-time monitoring and cloud-based automation.

NOTE: Inventronix has different views of the same dashboard for mobile and desktop views. Don't forget to copy your charts over to the mobile view.
What You'll Learn
- How to define a data schema for temperature monitoring
- How to send sensor data from an ESP32 to the cloud
- How to build a real-time dashboard with charts and status indicators
- How to create automation rules that send commands back to your device
What You'll Need
Hardware
- ESP32C3 development board (or any ESP32 with WiFi)
- 240V relay module (we only need one channel)
- DHT11 temperature and humidity sensor
- Female kettle lead adaptor (for mains input)
- Plug socket (for heater output)
- 240V to 5V USB power supply
- USB-C cable for programming
Software
- Arduino IDE (or PlatformIO)
- Inventronix Arduino library (install via Library Manager)
- Free Inventronix Connect account
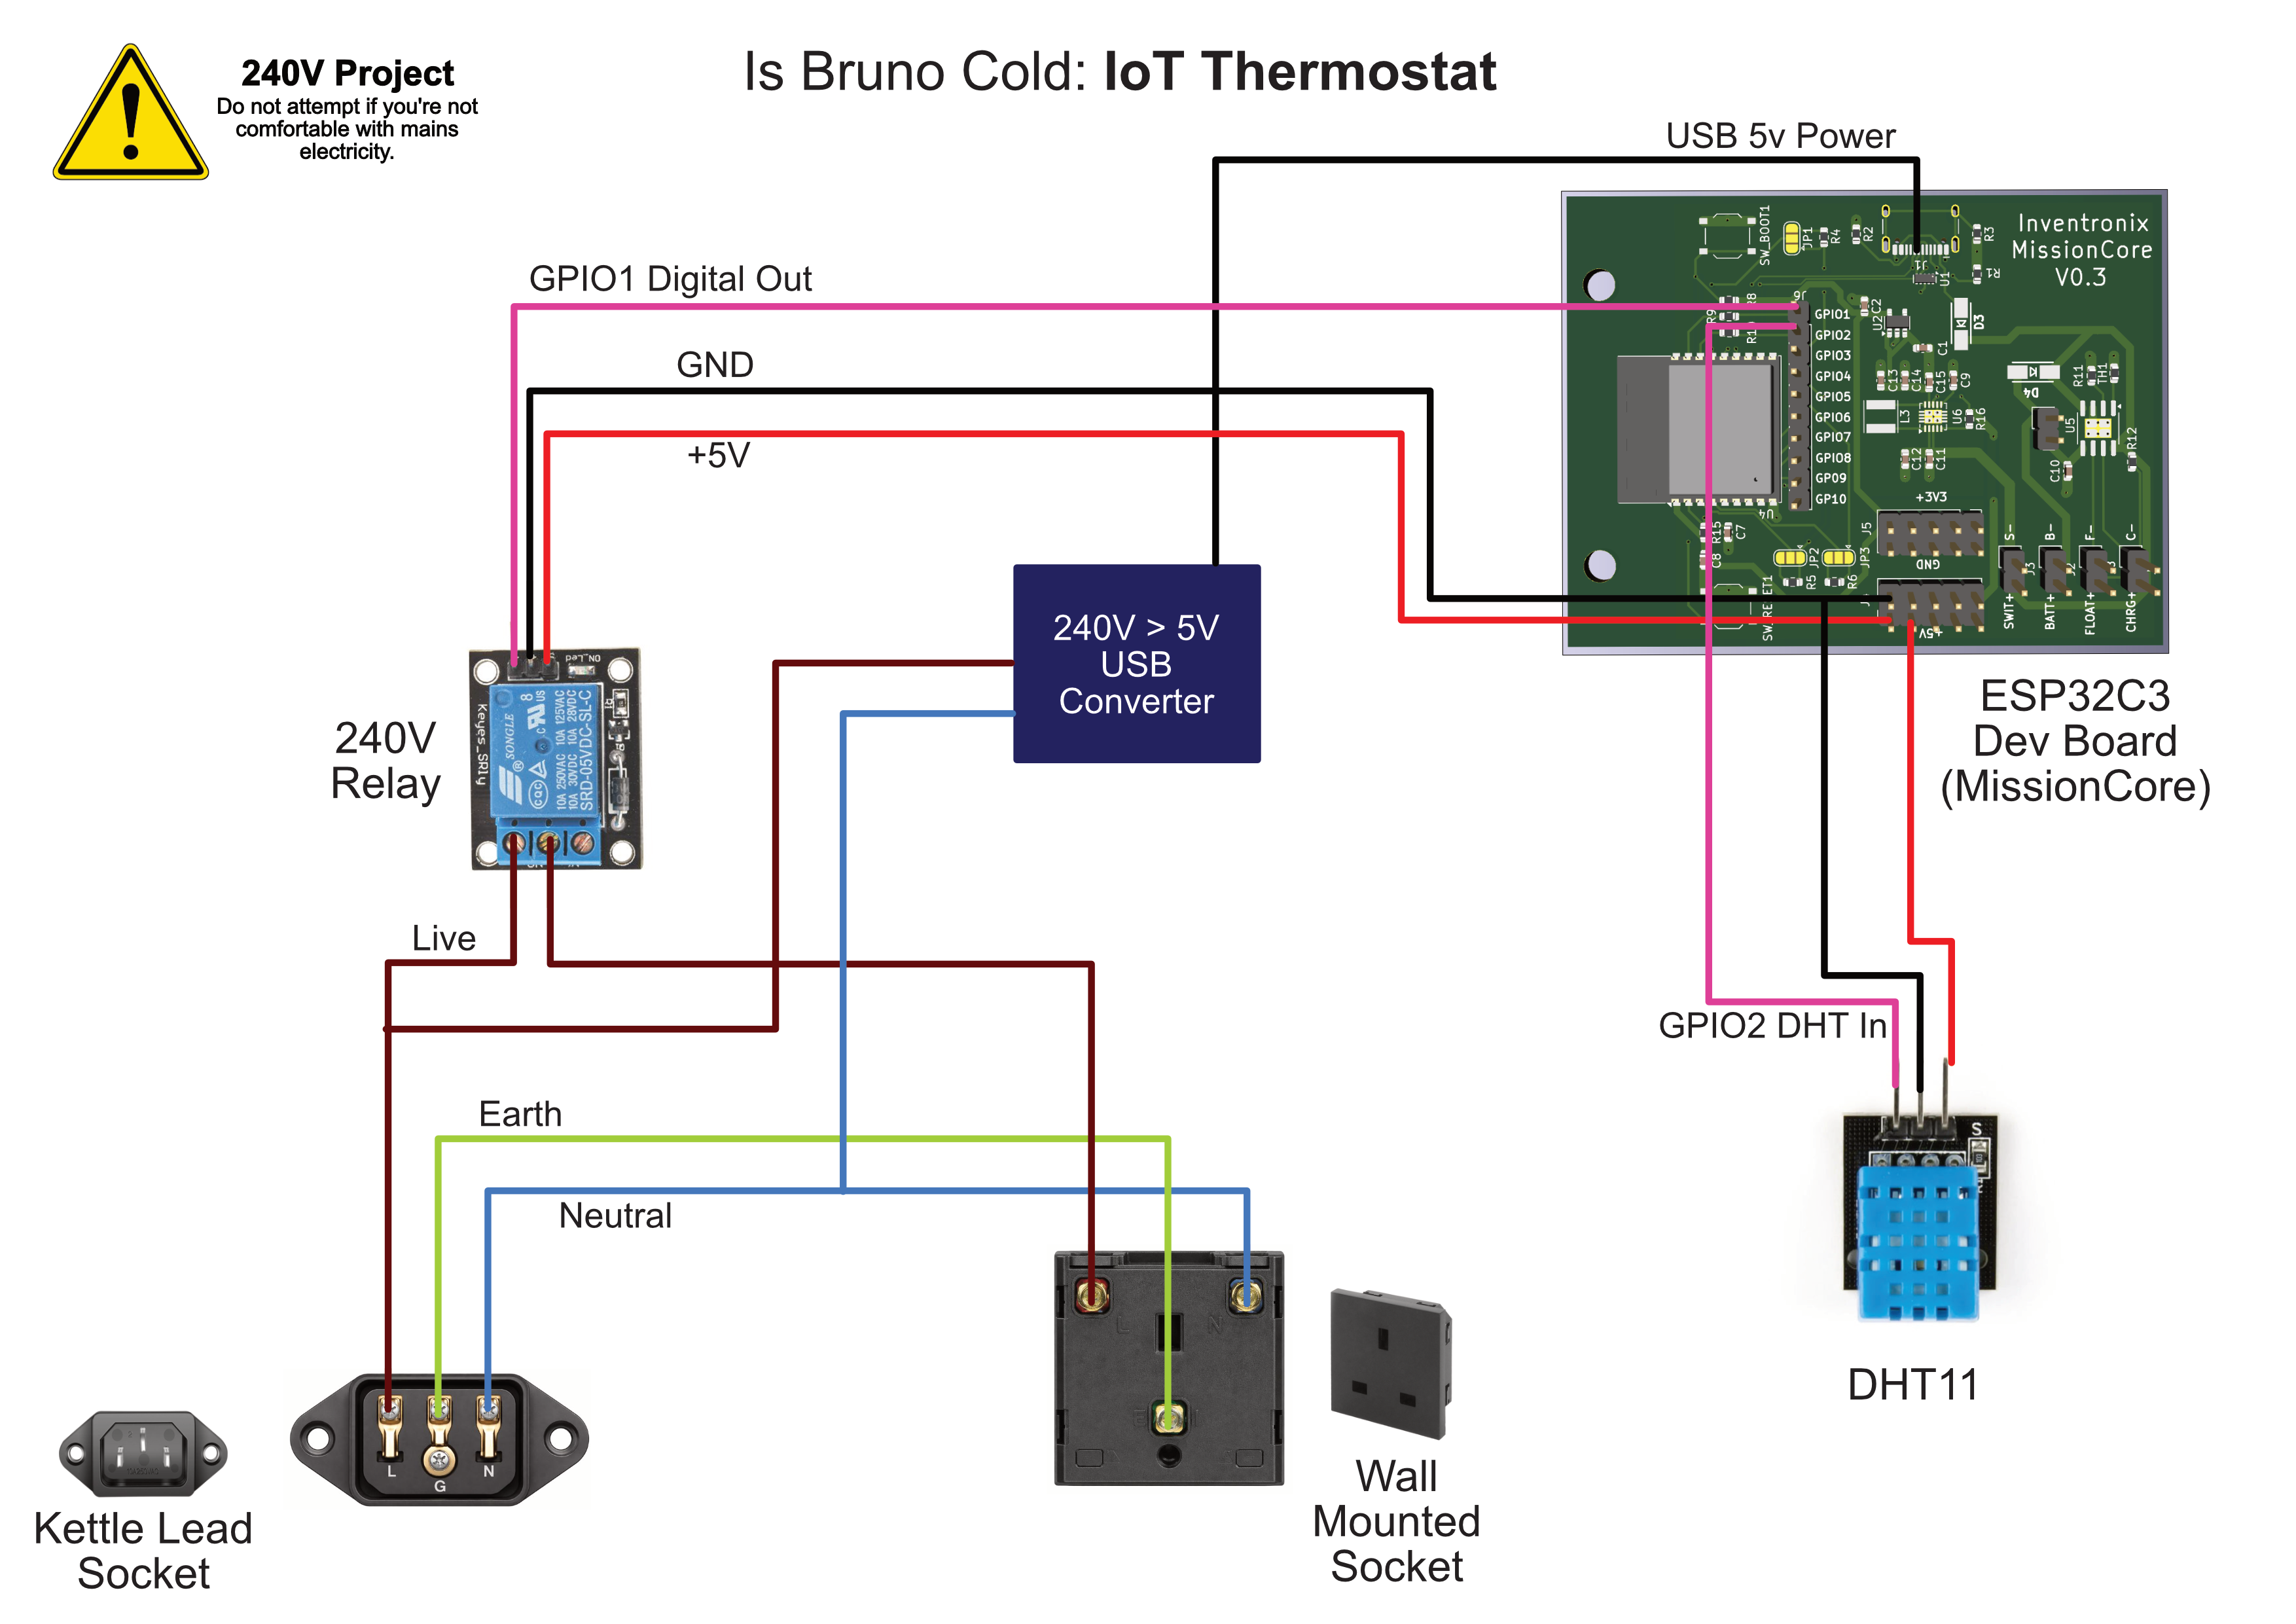
Hardware Setup
Safety Warning: This project involves mains voltage (240V). Only proceed if you're comfortable working with mains electricity. Always disconnect power before making changes, and consider using an enclosure to prevent accidental contact with live components.
Wiring
- Connect the DHT11 data pin to GPIO 2 on the ESP32
- Connect the DHT11 VCC to 3.3V and GND to ground
- Connect the relay signal pin to GPIO 1 on the ESP32
- Connect the relay VCC to 5V (from USB power) and GND to ground
- Wire the mains input through the relay's normally-open contacts to the output socket
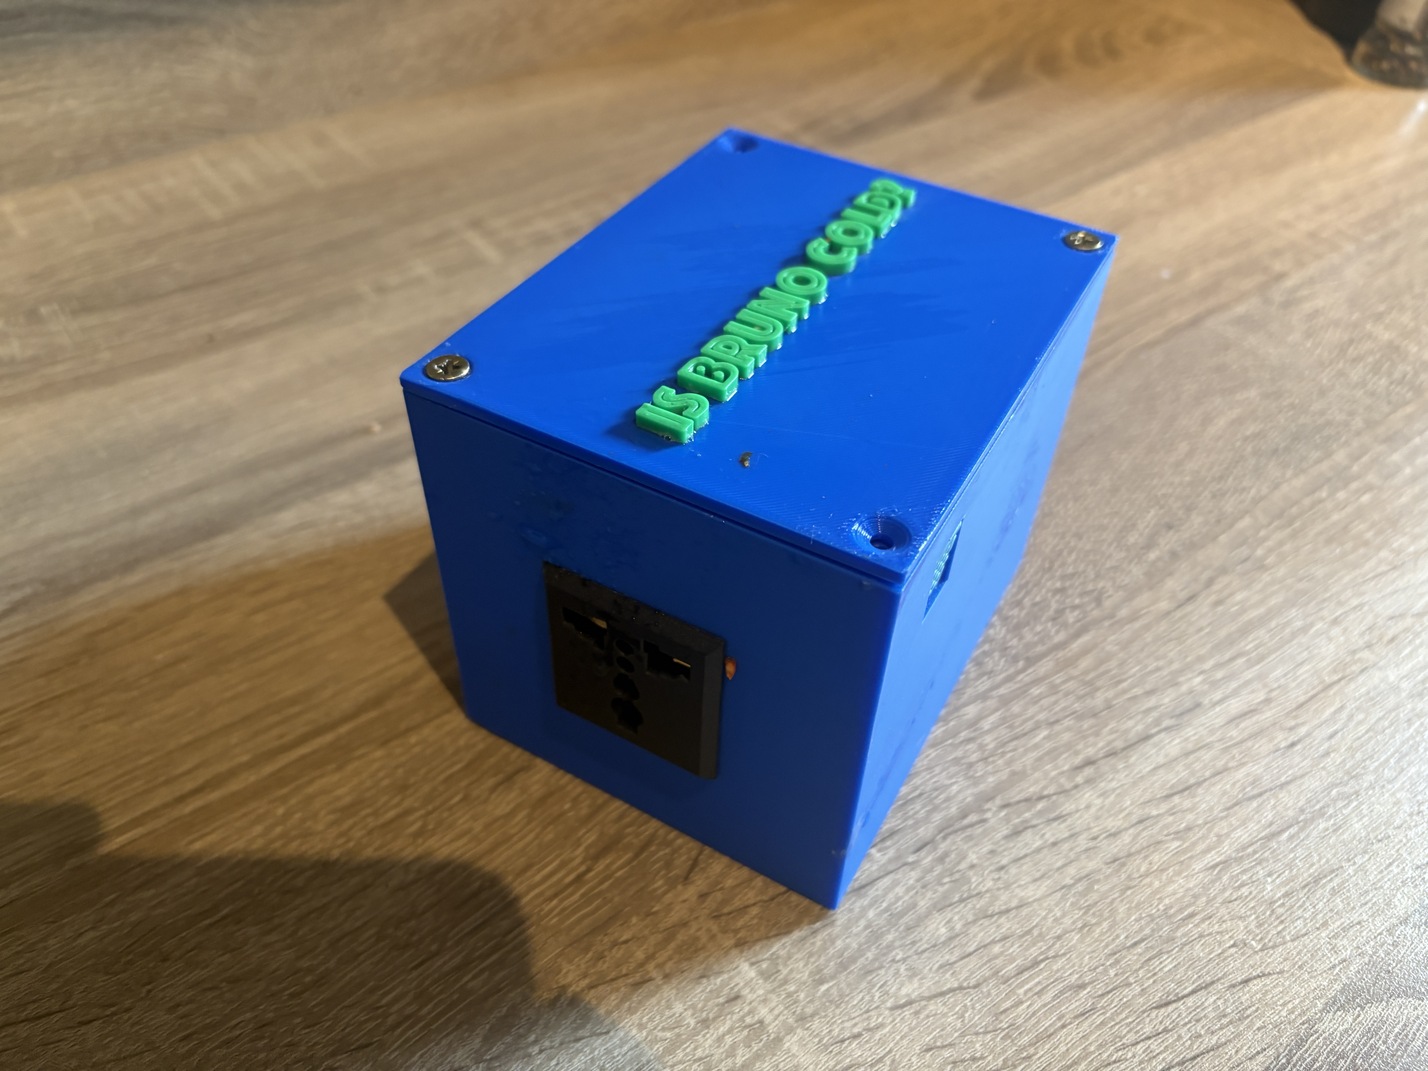
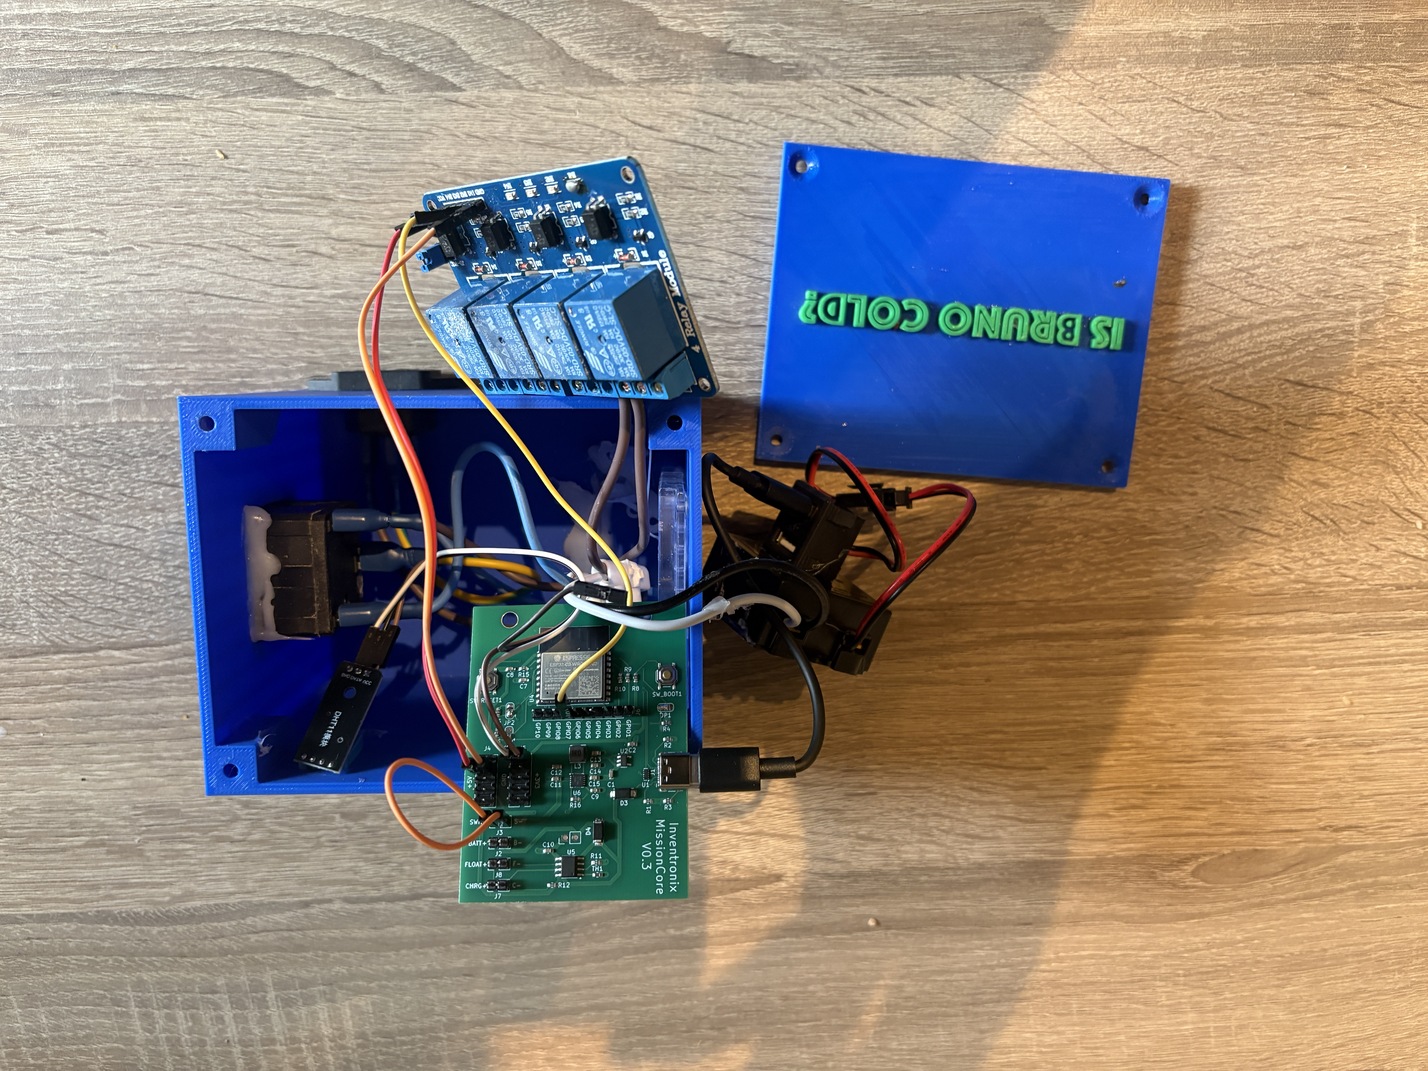
For this project we have 3D printed a simple enclosure to house all the parts.
Setting Up Inventronix Connect
Before writing any code, set up the cloud infrastructure that will store your data and run your automation rules.
Step 1: Create a Project
- Sign up or log in at Inventronix Connect
- Navigate to the Projects page
- Click New Project
- Name it something descriptive like "Smart Thermostat"
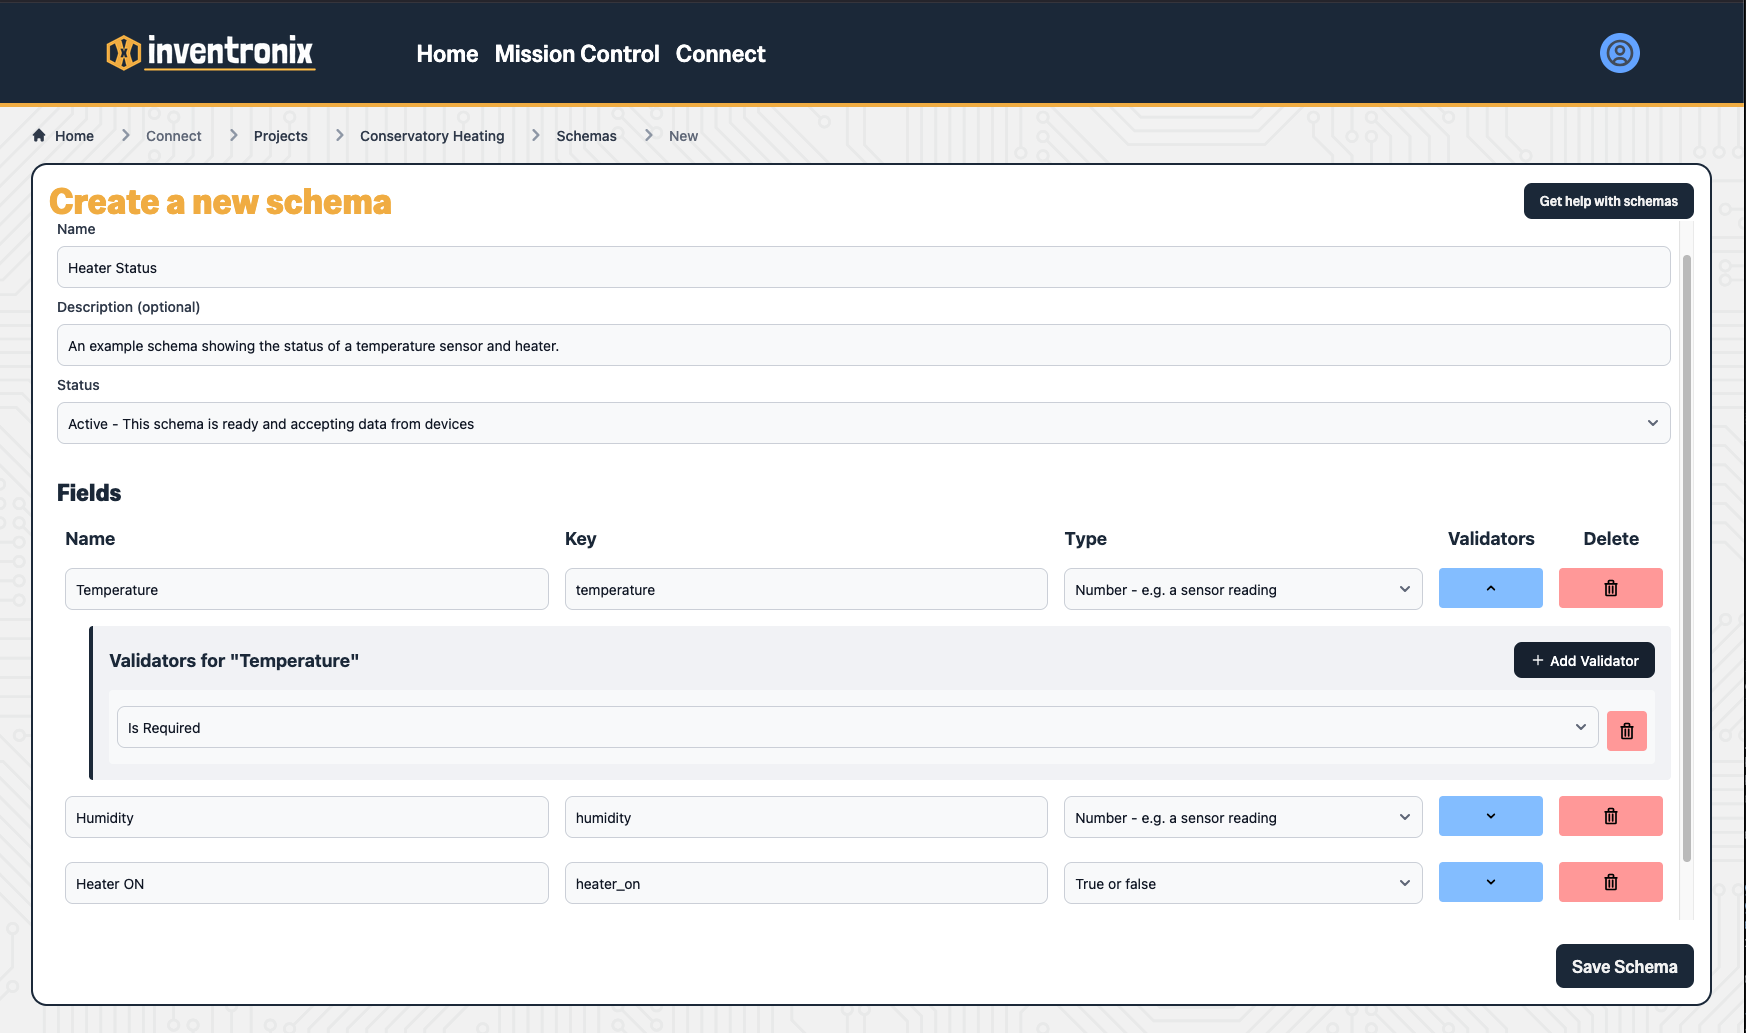
Step 2: Create a Schema
A schema defines the structure of data your device will send. For this thermostat, we need three fields:
- temperature (Number) - The current temperature reading in Celsius
- humidity (Number) - The current humidity percentage
- heater_on (Boolean) - Whether the heater relay is currently activated
To create the schema:
- In your project, go to Schemas
- Click New Schema and give it a name like "thermostat_readings"
- Add a field called `temperature` with type Number
- Add a field called `humidity` with type Number
- Add a field called `heater_on` with type Boolean
- Make the schema Active and press Save Schema to finish creating.
You can optionally add validators to your number fields. For example, set `temperature` to be between -40 and 80 to catch sensor errors.
Step 3: Get Your API Credentials
Your device needs two pieces of information to send data:
- Project ID - Found in your project settings
- API Key - Also in project settings. Keep this secret!
You can find these in the home page of your project. Copy them, you'll need them for your Arduino code!
The Arduino Code
Install the Inventronix library from the Arduino Library Manager, then upload the following code to your ESP32:
1 | |
How the Code Works
- Setup: Connects to WiFi, initializes the Inventronix library, and registers two command handlers (`heateron` and `heateroff`)
- Loop: Every 10 seconds, reads the sensor, builds a JSON payload with the current temperature, humidity, and heater state, then sends it to the cloud
- Commands: When the cloud sends a command (via a rule), the library automatically calls the registered handler to turn the relay on or off
Notice that we report the actual state of the heater pin (`digitalRead(HEATER_PIN)`), not what we think it should be. This ensures your dashboard always shows reality.
Test the Connection
Before building the dashboard, verify that data is flowing correctly:
- Upload the code to your ESP32
- Open the Serial Monitor (115200 baud)
- Watch for "WiFi connected" followed by "Data sent successfully" messages
- In Inventronix Connect, go to your project's Payloads Explorer
- You should see payloads arriving every 10 seconds with your sensor data
If you see "Validation Failure" instead of successful payloads, check that your schema field names exactly match the JSON keys in your code (`temperature`, `humidity`, `heater_on`).
Create the Dashboard
Now build a dashboard to visualize your thermostat data in real-time.
Step 1: Create a New Dashboard
- In your project, go to Dashboards
- Click Create a New Dashboard
- Name it "Thermostat Monitor" (You can edit the name by clicking the pencil icon)
Step 2: Add a Temperature Line Chart
This chart shows temperature over time, with the background shaded to indicate when the heater was on.
- Click the + button to add a chart
- Select Line Chart
- Name it "Temperature Over Time"
- Set Source to the `temperature` field from your schema
- Set Aggregation to `Average`
- Set Time Bucket to `5 minutes`
- Set Time Range to `24 hours`
- Under Overlays, click 'Show boolean status regions' and select `Heater On` of your schema.
The boolean overlay shades the chart background green when the heater is on, making it easy to correlate heater activity with temperature changes.
Step 3: Add a Temperature Gauge
A gauge provides an at-a-glance view of the current temperature with color-coded thresholds.
- Add another chart and select Gauge
- Name it "Current Temperature"
- Set Source to `temperature` on your schema
- Set Aggregation to `Last Value`
- Set Min Value to `10` and Max Value to `30`
- Add thresholds: `15` (blue - cold), `23` (green - ideal), `25` (red - hot)
Step 4: Add a Heater Status Indicator
A boolean status widget shows whether the heater is currently on or off.
- Add a Boolean Status widget
- Name it "Heater Status"
- Set Source to `heater_on`
- Set True Label to "Heating"
- Set False Label to "Idle"
- Optionally set colors (e.g., orange for heating, gray for idle)
Step 5: Add a Heartbeat Monitor
A heartbeat widget alerts you if the device stops sending data.
- Add a Heartbeat widget
- Name it "Device Status"
- Select your thermostat schema
- Set Warning to `60` seconds (device hasn't reported in 1 minute)
- Set Critical to `300` seconds (device might be offline)
The heartbeat shows green when data is flowing normally, yellow when there's a delay, and red when the device may be offline.
Set Up Automation Rules
Rules evaluate your incoming data and trigger actions automatically. For a thermostat, we need two rules: one to turn the heater on when it's cold, and one to turn it off when it's warm enough.
Rule 1: Turn Heater On When Cold
This rule triggers when the average temperature over 5 minutes drops below 16 degrees.
- Go to Rules in your project
- Click New Rule
- Name it "Turn Heater On"
- Set the Schema to your thermostat schema
Configure the Condition:
- Field: `temperature`
- Aggregation: `avg` (average)
- Time Bucket: `5m` (5 minutes)
- Operator: `less than`
- Value: `16`
Configure the Action:
- Click Add Action
- Select Device Command
- Set Command Name to `heater_on`
Set a Cooldown:
Set the cooldown to `5m` (5 minutes). This prevents the rule from firing repeatedly while the heater is warming up the room. Without a cooldown, the rule would trigger on every payload while the temperature is below threshold.
Rule 2: Turn Heater Off When Warm
This rule triggers when the average temperature rises above 17 degrees.
- Create another rule named "Turn Heater Off"
- Use the same schema
Configure the Condition:
- Field: `temperature`
- Aggregation: `avg`
- Time Bucket: `5m`
- Operator: `greater than`
- Value: `17`
Configure the Action:
- Add a Device Command action
- Set Command Name to `heater_off`
Set the cooldown to `5m` as well.
Why the 1-degree gap? Using 16 and 17 instead of a single threshold prevents rapid cycling. Without this "dead band", the heater would constantly toggle on and off as the temperature hovers around the threshold.
Optional: Manual Control
You can add Action Buttons to your dashboard to manually trigger the heater on or off, overriding the automatic rules.
- First, create two standalone Actions in your project (one for `heateron`, one for `heateroff`)
- In your dashboard, add an Action Button widget
- Link it to your "heater on" action
- Add another button for "heater off"
Now you can override the automatic thermostat with a single click from your phone or computer.
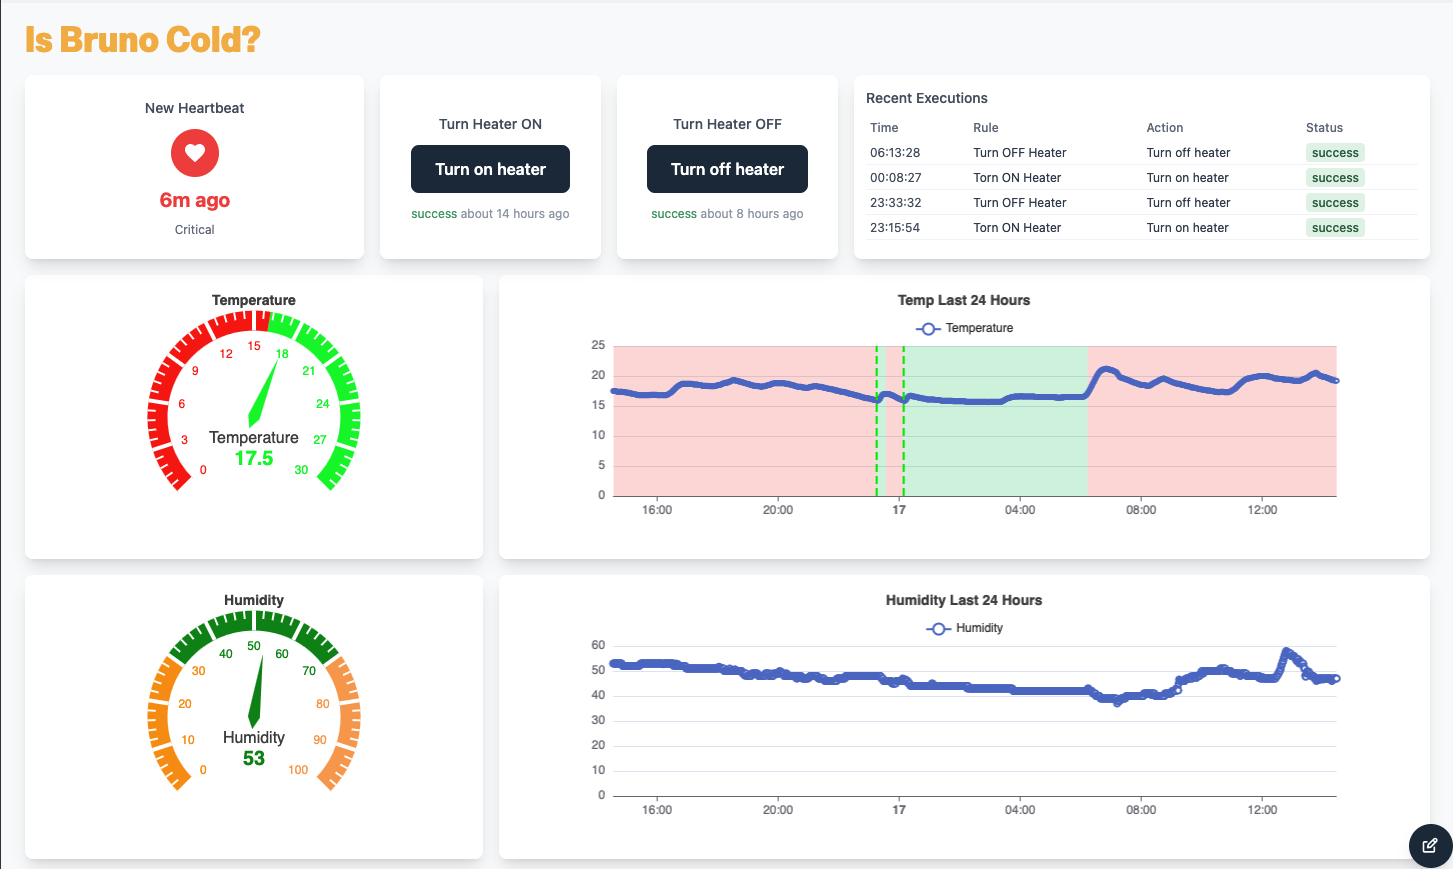
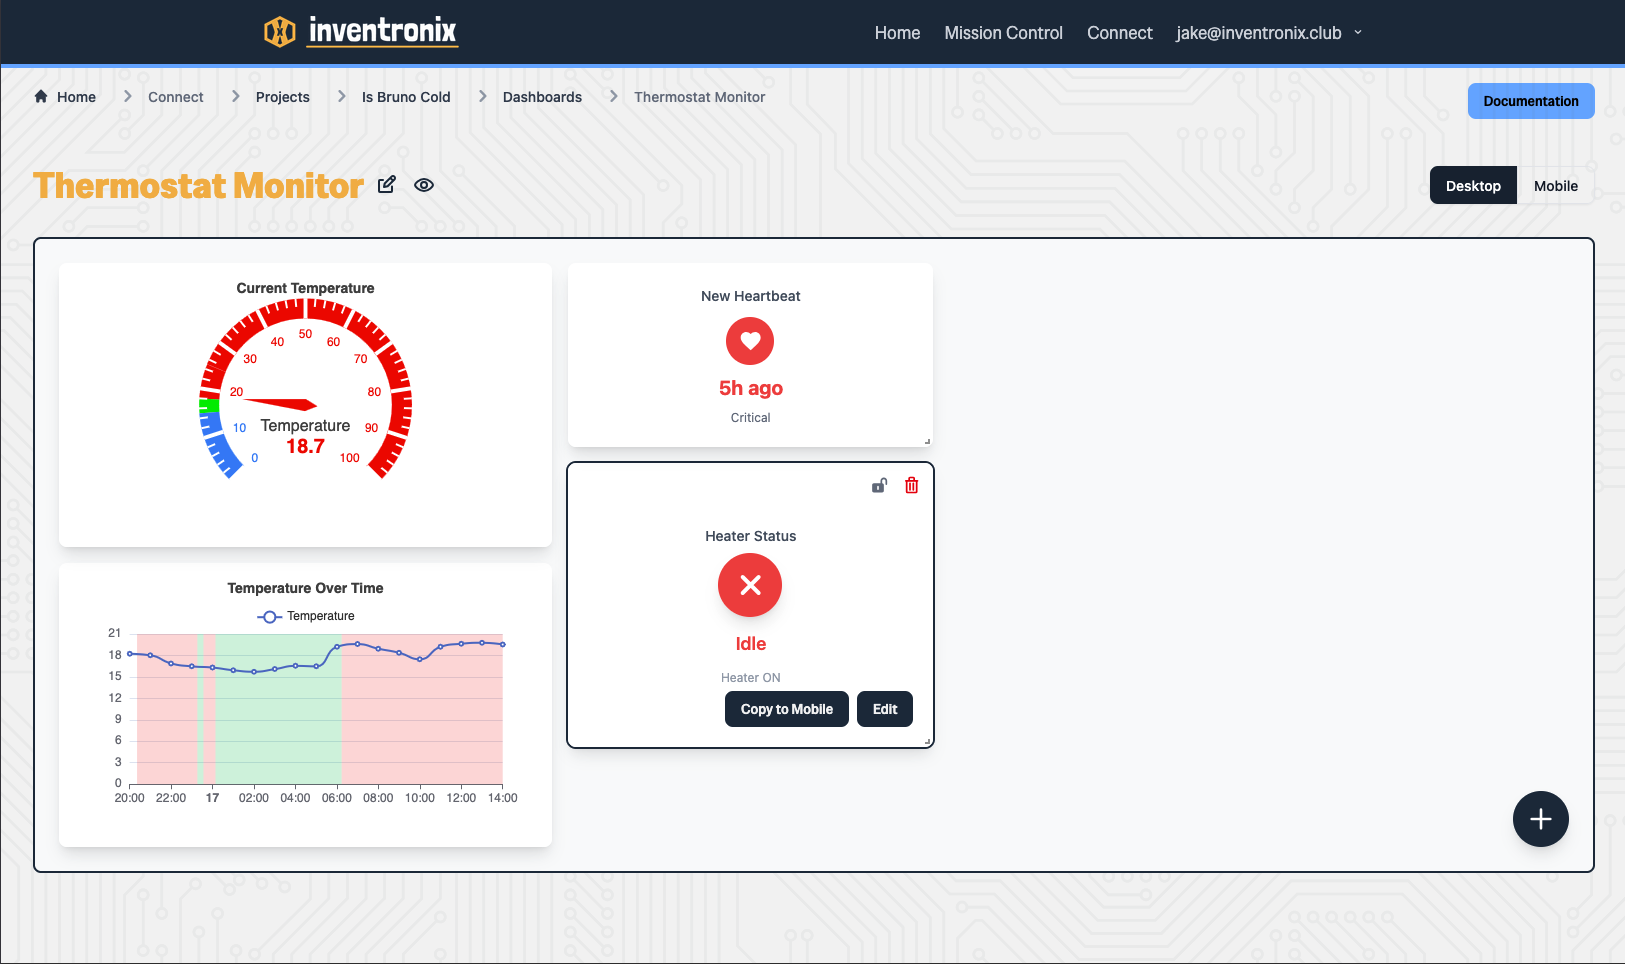
Results
Here's what a typical overnight run looks like:
The chart clearly shows the thermostat cycle:
- Temperature gradually drops as the room cools
- When it hits the threshold, the rule fires and the heater turns on (green shading begins)
- Temperature rises until it exceeds the upper threshold
- The heater turns off (green shading ends)
- The cycle repeats as needed
DOGGO IS HAPPY!
Cost Summary
- Hardware: Approximately £15-20 for all components
- Software: Free (Inventronix Connect has no cost for hobby projects)
- Build time: 2-3 hours including setup and testing
Next Steps
Once the basic thermostat is working, consider these enhancements:
- Email notifications - Get alerted if the temperature drops below a critical threshold (e.g., 10 degrees means something is wrong)
- Time-based rules - Only enable heating during certain hours (e.g., 5pm to 10am)
- Multiple zones - Add more sensors and relays to control heating in different rooms
- Humidity control - Use the humidity data to trigger a dehumidifier or ventilation fan